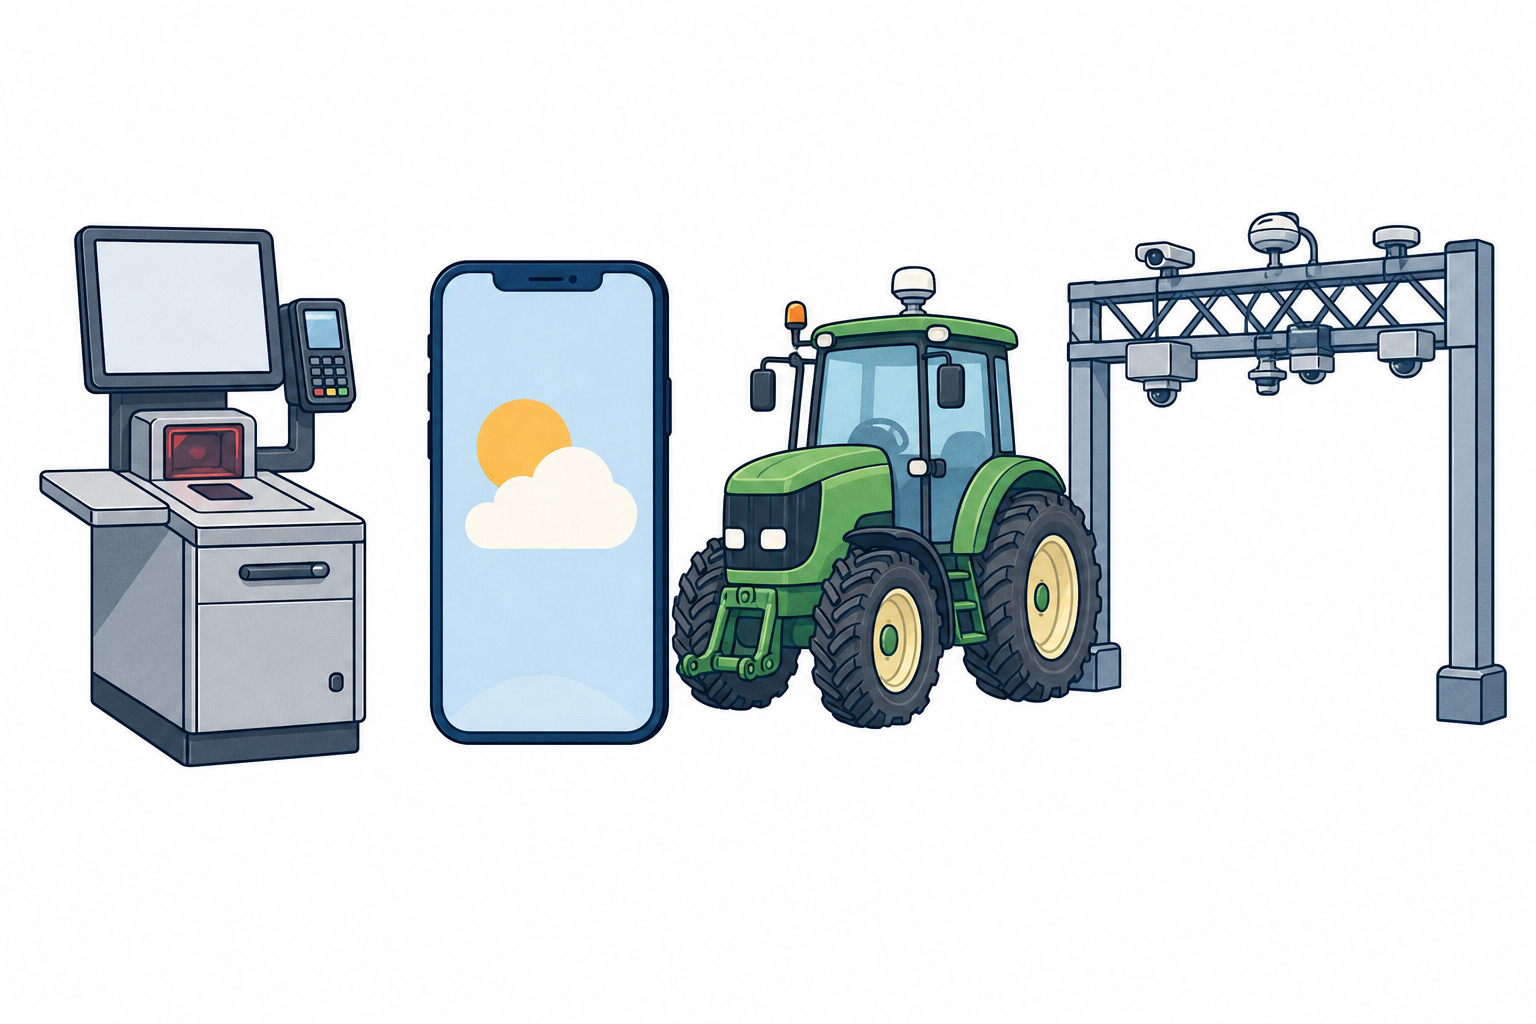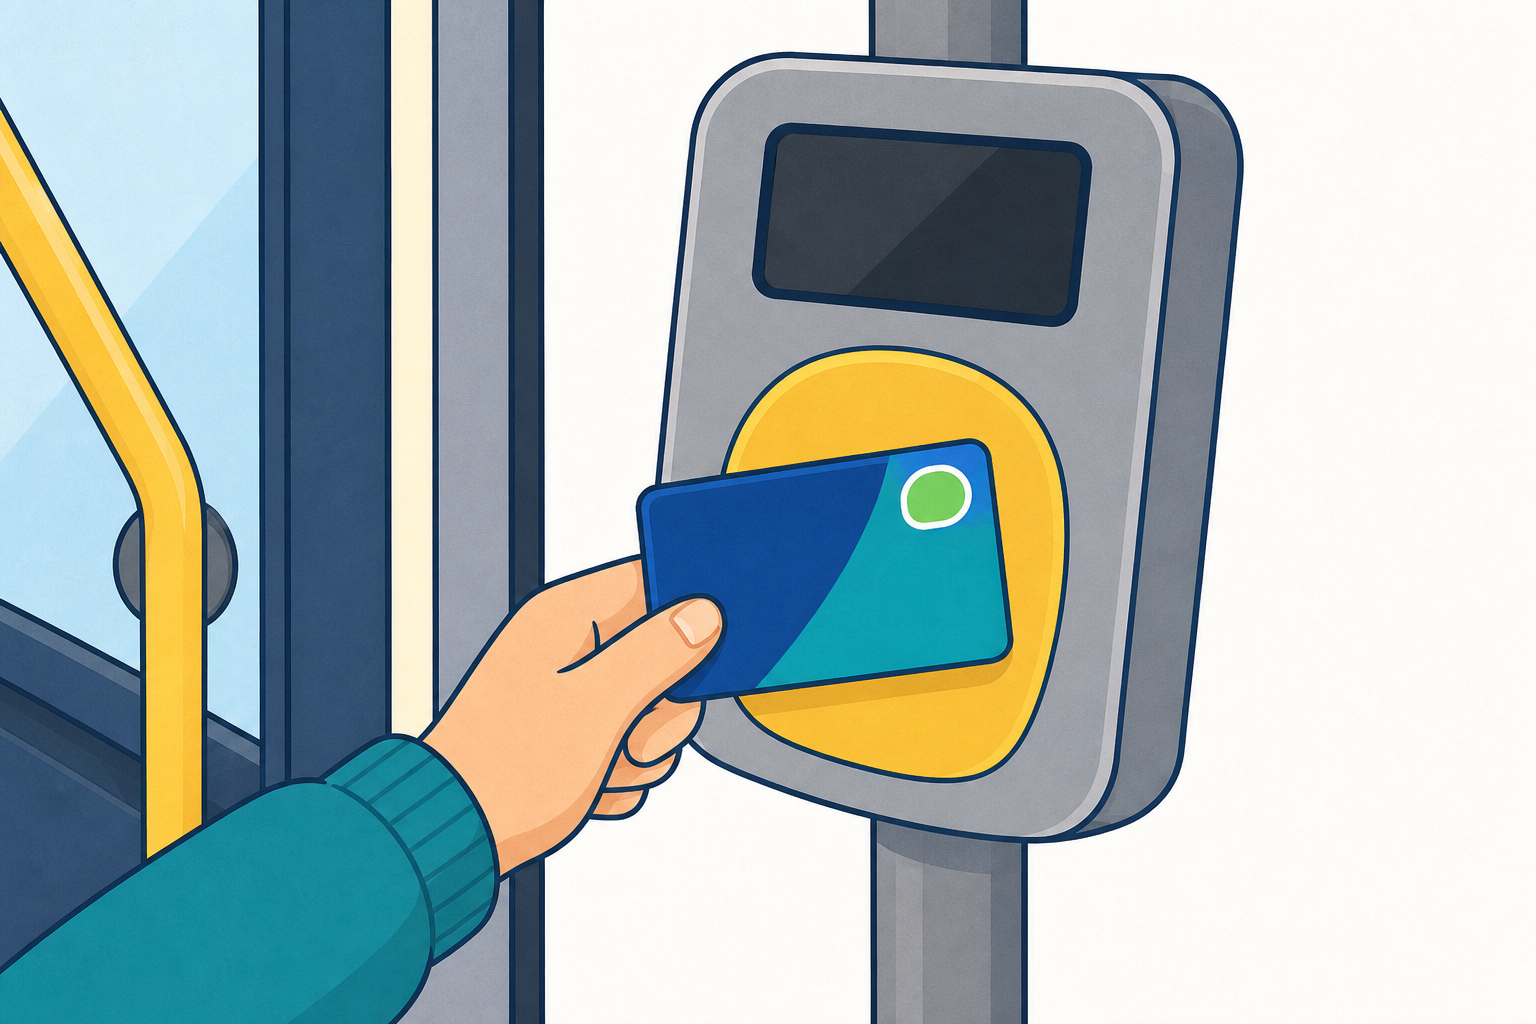
Think of one digital system you used today or this week in Ireland. A Leap card on the bus, a self-checkout in a shop, a weather app before PE, or a machine on a farm. What did you put in, and what came out?
Hands up: which one do you think quietly collects the most data about you?
Keep this light. Do not hand out research cards or start IPO mapping yet. Take three or four quick examples from the class and park them on the board as a short list only.
Nature of Technology hook: technologists describe any system as inputs, processes and outputs before they build or fix it. Today pupils will do that for real Irish systems and notice the data each one uses.
If nobody names privacy or data, leave that for the key-concepts beat. Do not lecture here.
Technologists sketch a system before they build or fix it. Here are the words they use.
Input: what goes into the system. Process: what the system does with it. Output: what comes out. Data: the facts the system collects or uses along the way.
The phone or machine is not the process. The process is the work it does. Next we will map a real Leap card journey with these words.
Board stays short. The full table is for you. Do not fully solve the Leap journey here; keep that for the interactive in the next step so the class meets IPO once as a complete arc.
| Concept | Why it matters | Example |
|---|---|---|
| Input — what goes into the system (a tap, a scan, a button press, a sensor reading) | If you cannot name the input, you cannot explain how the system starts | Tapping a Leap card on a bus reader; scanning a barcode at self-checkout |
| Process — what the system does with the input (check, calculate, decide, store) | The process is the hidden work people often miss when they only watch the screen | Checking fare and balance; matching a barcode to a price; turning weather readings into a forecast |
| Output — what comes out (a beep, a gate opening, a total, a map, a message) | Outputs are how we judge whether the system did its job | Gate opens; receipt prints; rain warning appears on a phone |
| Data — facts the system collects, stores or uses (times, places, prices, account IDs) | Data helps the system work, but it also raises fair questions about privacy | Journey times on public transport; a shopping list of scanned items; farm soil moisture readings |
Misconception to head off: pupils may say the phone or the machine is the process. The device is the hardware; the process is the work it does with the input. Say this once in plain words; do not open a full Leap walkthrough yet.
Data is not a fourth IPO column: when we map later, data sits with the process as facts the process uses or stores. Groups will label data clearly on posters without inventing a fourth box. Leave the placement puzzle for the next step.
Link forward: next we place Leap cards on the board together; then groups research a different Irish system (not Leap).
We will build an Input → Process → Output map for a Leap card journey. Look at three cards on screen: tap the Leap card, check balance and journey, and gate opens or beep confirms. Call out which column each belongs in.
Now look at the last card: journey time and stop logged. Is that something you hear or see like a beep, or something the system quietly keeps? Where should it go, and why?
Beat 1 — place the three clear cards. Show only or focus first on: tap the Leap card, check balance and journey, and gate opens or beep confirms. Invite the class to call out Input, Process or Output. Do not mention the data-trail rule yet.
Agreed placement for beat 1:
Beat 2 — puzzle the journey-log card. Reveal or point to journey time and stop logged. Ask: Is this an output you hear or see, or facts the system keeps? Take two or three ideas. Only after pupils have tried, state the rule:
Final agreed placement:
After placement, ask: Who might use that journey data, and what would be fair?
Fold the room in: when a few pupils direct the board, ask the rest: Are they right? What data is being collected? Would you change anything?
Worked model language (say after placement, not before): I wonder how a Leap card journey works as a system. I predict the input is the tap, the process checks money and the journey, and the output is the beep or open gate. I observed that the system also stores journey data so the balance updates, so that data trail sits with Process. I think every digital system we meet today will have inputs, processes, outputs and some data trail.
This is the model. Groups will map a different Irish system next, on paper and poster. No group repeats Leap.
In groups, take one research card: self-checkout, weather app, smart farming, or eFlow toll tag. Read the clues together. Decide the inputs, the process, the outputs, and the data the system uses. Justify each choice from the clues, not from guessing wildly.
On your poster, sketch a clear IPO map, label the data trail, and choose which data matters most. Write one privacy or fairness question your group chose and can explain, matched to the data you said matters most. Be ready for a short share.
Copy or print the four cards below exactly. Cut into four separate cards. Clues only; groups must decide IPO. Do not add the teacher model answers to pupil cards.
—— Card A — Self-checkout ——
—— Card B — Weather app ——
—— Card C — Smart farming ——
—— Card D — eFlow toll tag ——
Give about 17 minutes. Circulate and ask each group to point to input, process, output and data on their poster and to justify choices from the card clues. Push the two real decisions: Which data matters most for the job? and Which privacy question can you explain and stand over? Do not require a separate rehearsal of the share; the share stem in the next step carries that. If a group finishes early, ask them to add one way the system helps people in Ireland and one risk if the data were shared carelessly.
Success look-fors: IPO justified from clues (not copied as a finished answer); at least one named data example with a judgement about which matters most; one thoughtful privacy or fairness question the group chose and can explain, matched to that data.
This is your technologist's sketch: clear labels beat fancy drawing. Capture enough so you can teach the class how the system works.
On your Investigation Journal page, make a quick labelled IPO sketch of your system (use the poster; do not redraw every decoration). Mark the data trail. Add one sentence on how the system helps people in Ireland, and write the privacy or data question your group chose.
This is a light paper recording beat for the Investigation Journal page, not a second full poster. Pupils transfer labels from the poster; art quality does not matter.
Prompt strugglers with stems said aloud: Input is… Process is… Output is… Data used is… Our question is…
Do not invent extra columns or tell them the journal has named boxes you designed. Say what to record; the page layout is generated separately.
Keep posters free for the share. Aim to finish this beat in about five minutes so every group can be heard next.
You're previewing this lesson. Get full access to this lesson and hundreds more — each one ready to teach, with interactive activities, printable resources and pupil progress tracking built in.