Today you will
- save a PDF that shows only your chart
- check a block of numbers in print preview
- save a PDF with your chart and its numbers on one page
Think of one chart in your Something Real sheet. If your Work Experience supervisor only had 30 seconds, would you send the chart, the numbers, or both on one page?
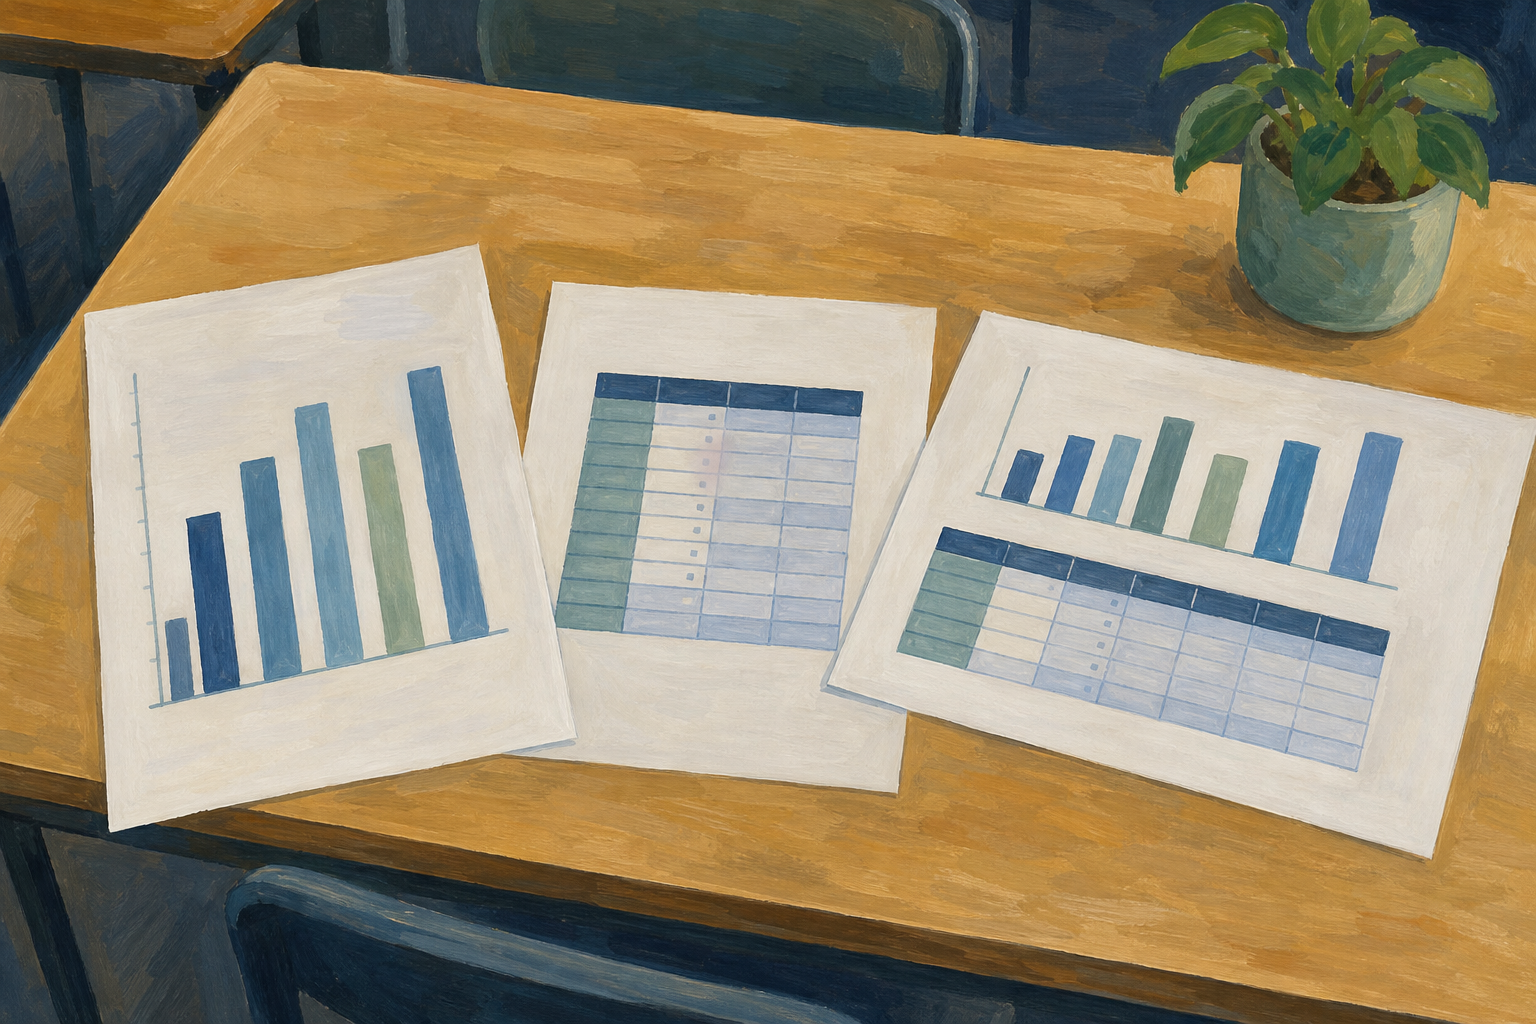
A chart-only PDF shows the chart and almost nothing else.
A chart-plus-data PDF puts the chart and its table of numbers on one page.
Print preview shows the page before you save it, so you can fix problems first.
A PDF looks the same on any phone or computer.
Example
A sponsor asks if sales are going up, so you send the chart alone. A club treasurer wants to check costs, so you send the chart with its table.
Follow the steps in the box below to save a PDF that shows only your chart. Use {{code:sm3_interpretation_practice}}, your weekly sales practice sheet.
If you do not have it, make a new sheet with that name in {{code:09_specialism/sm3/}}. Paste this table into cell {{cell:A1}}, then select {{range:A1:B7}} and insert a column chart.
| Week | Sales (€) |
|---|---|
| Week 1 | 45 |
| Week 2 | 52 |
| Week 3 | 48 |
| Week 4 | 95 |
| Week 5 | 50 |
| Week 6 | 55 |
Common problems
- The PDF has lots of empty pages. Hide spare rows and columns around your chart and table, then check print preview.
- The chart is tiny or cut off. Make it bigger on the {{code:chart_only}} sheet and switch to Landscape.
- I can't find my PDF. Look in your Downloads folder, then move it into {{code:Project_Portfolio/09_specialism/sm3/}}.
Independent Practice
- Copy your chart to a {{code:chart_only}} sheet and save it as {{code:sm3_chart_only.pdf}}.
- Back on the data sheet, make sure the chart sits beside its table.
- Right-click the spare columns and rows around them and choose Hide.
- Click {{menu:File -> Print}}, choose the current sheet and set Landscape.
- When the chart and table fit on one page, save it as {{code:sm3_chart_with_data.pdf}}.
If your chart isn't ready, use {{code:sm3_interpretation_practice}} and tell your teacher.
- {{code:sm3_chart_only.pdf}} shows one big, clear chart.
- {{code:sm3_chart_with_data.pdf}} shows the chart and its numbers on one page.
- Both files are in {{code:Project_Portfolio/09_specialism/sm3/}}.
Unlock the full learning experience
You're previewing this lesson. Get full access to this lesson and hundreds more — each one ready to teach, with interactive activities, printable resources and pupil progress tracking built in.
This lesson is copyright of Coding Ireland 2017 - 2026. Unauthorised use, copying or distribution is not allowed.