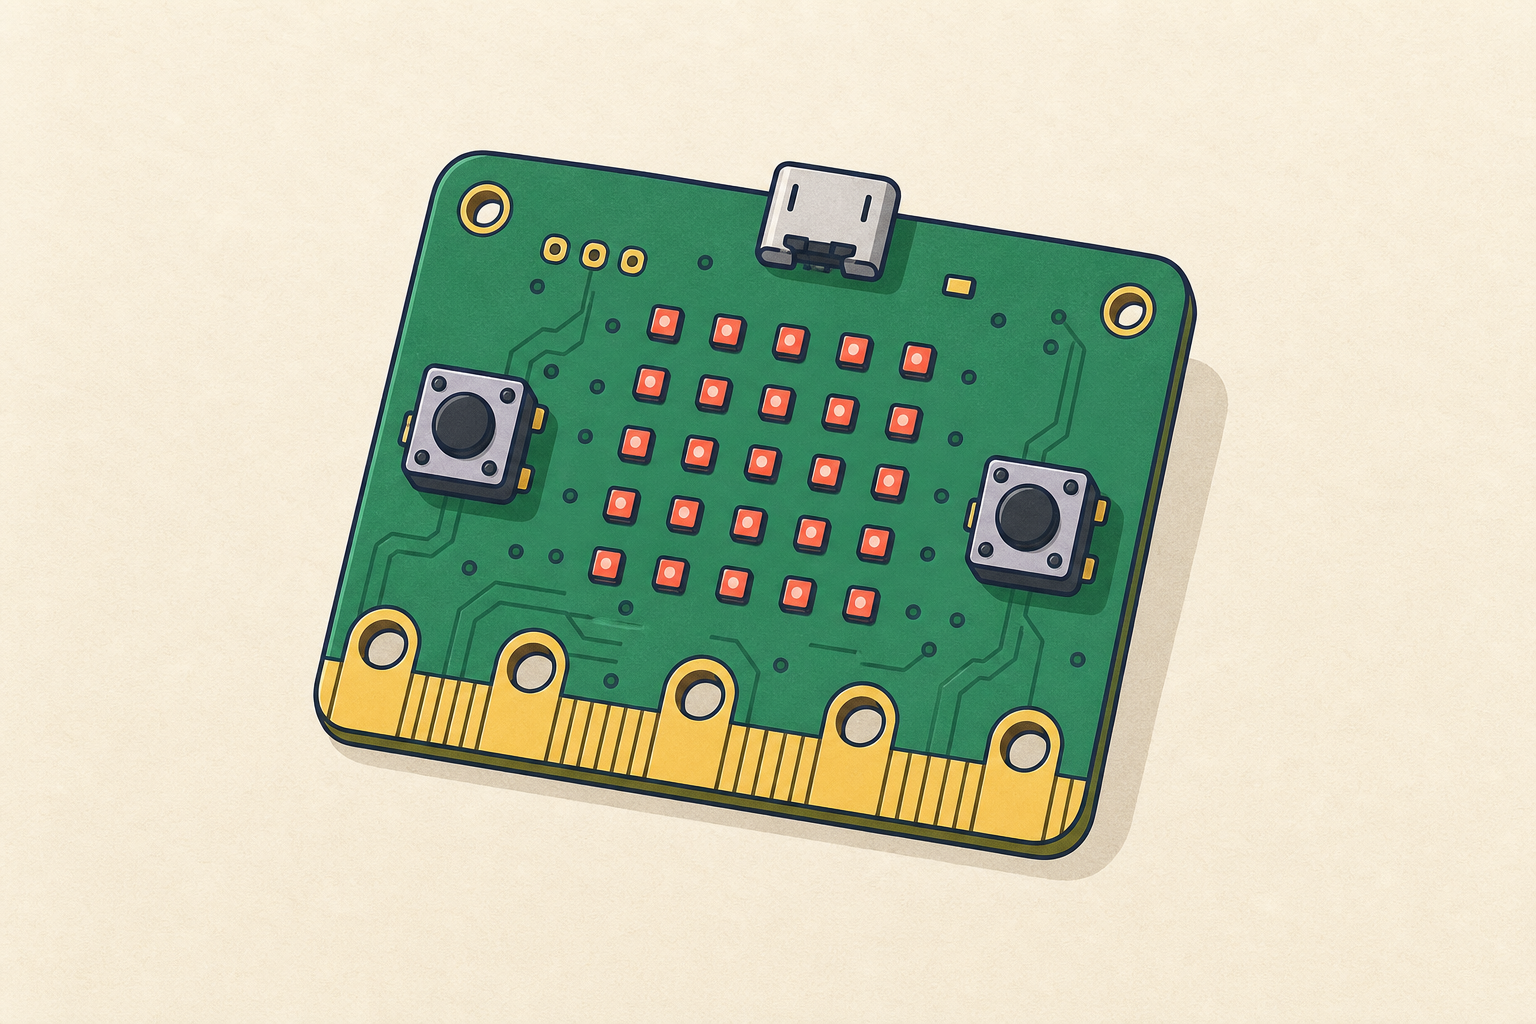
Microbit
Advanced
50 mins
Teacher/Student led
+55 XP

Micro:bit: Logging Data Over Time

Pupils program a micro:bit to sense and graph readings, then log a sensor over time and read the graph for a trend — noticing what rises, falls or changes and when.

Teacher Class Feed

Load previous activity

    1 - What We're Building ~5 mins

    Illustration for What we're buildingPeople who work with sensors — weather stations, hospital monitors, farm soil probes — rarely rely on a single reading. They take the same measurement again and again over time and watch how it changes. That's how you tell whether something is warming up, cooling down or holding steady.

    Today you'll turn your micro:bit into one of those instruments. First you'll show a reading on the screen, then you'll make it draw a live graph so you can watch the numbers rise and fall as the world around the board changes. Watch the board first as each piece is modelled, then build it with your partner and run it to see what happens.

    2 - Create a New Project ~3 mins

    Go to the makecode.microbit.org website and create a new project.

    3 - Show Light Level ~8 mins

    The first sensor that we'll look at is the light level sensor. This senses how much light from the surrounding environment is hitting the front of the Microbit.

    This number can be between 0 (black) and 255 (white).

    Let's display the light level on the Microbit now. 

    basic.forever(function () {
        basic.showNumber(input.lightLevel())
    })
    You can change the amount of light on the Microbit simulator by using the yellow/grey circle in the top left corner (watch the gif for this step).

    Make sure to download the code on to your Microbit to test it out for real by shining more/less light on it!


    4 - Graph Light Level ~6 mins

    We'll now do something a bit more interesting using the light level. We can view the light level on a graph that will illustrate the changes in light.

    basic.forever(function () {
        led.plotBarGraph(
        input.lightLevel(),
        255
        )
    })

    You can view the graph on the simulator on your computer (click the "show data" button under the Microbit). Change the light level on the Microbit simulator and see how the graph changes!

    Then, download the code on to your Microbit.


    5 - Graph Other Sensors ~21 mins

    Now, we are going to change the code to make use of the other sensors on the Microbit. After each step you can test your change on both the simulator and your Microbit after you download the code.

    Try to think about what the "up to" value should be in the plot graph code block during each step. If you are unsure then you can just put in 1023 (this is the maximum the Microbit allows).

    All of these sensor blocks can be found in the Input block section.

    Steps:

    1. Graph the temperature (up to 50 for celcius, 120 for fahrenheit). You can cup the Microbit tightly in your hands to increase the temperature, however this may be quite slow. Try putting it next to something hot (not too hot!) like a radiator or a hairdryer.
    2. Graph the compass heading (up to 359).
    3. Graph the acceleration (in different directions, e.g. x-direction, y-direction, etc.)
    4. Graph the magnetic forces (only if you have some sort of magnet)
    5. Graph the sound level (up to 255) (only if you have the new V2 Microbit with the sound sensor)
    basic.forever(function () {
        led.plotBarGraph(
        input.temperature(),
        50
        )
    })
    
    
    basic.forever(function () {
        led.plotBarGraph(
        input.compassHeading(),
        359
        )
    })
    
    
    basic.forever(function () {
        led.plotBarGraph(
        input.acceleration(Dimension.X),
        1023
        )
    })
    
    basic.forever(function () {
        led.plotBarGraph(
        input.magneticForce(Dimension.X),
        1023
        )
    })
    
    
    basic.forever(function () {
        led.plotBarGraph(
        input.soundLevel(),
        255
        )
    })
    
    
    Pupil practice · Investigation Journal
    Module 4 · Technology: a Coding Build, Micro:bit Data and Presenting Data
    Lesson 27 · Micro:bit: Logging Data Over Time
    Download Investigation Journal sheet (PDF)
    123learn · Online learning platform

    Unlock the full learning experience

    You're previewing this lesson. Get full access to this lesson and hundreds more — each one ready to teach, with interactive activities, printable resources and pupil progress tracking built in.

    Hundreds of curriculum-aligned lessons
    Interactive activities in every lesson
    Printable resources & progress tracking
    Copyright Notice
    This lesson is copyright of Coding Ireland 2017 - 2025. Unauthorised use, copying or distribution is not allowed.
    🍪 Our website uses cookies to make your browsing experience better. By using our website you agree to our use of cookies. Learn more