Today you will
- save your bar chart and pie chart as picture files
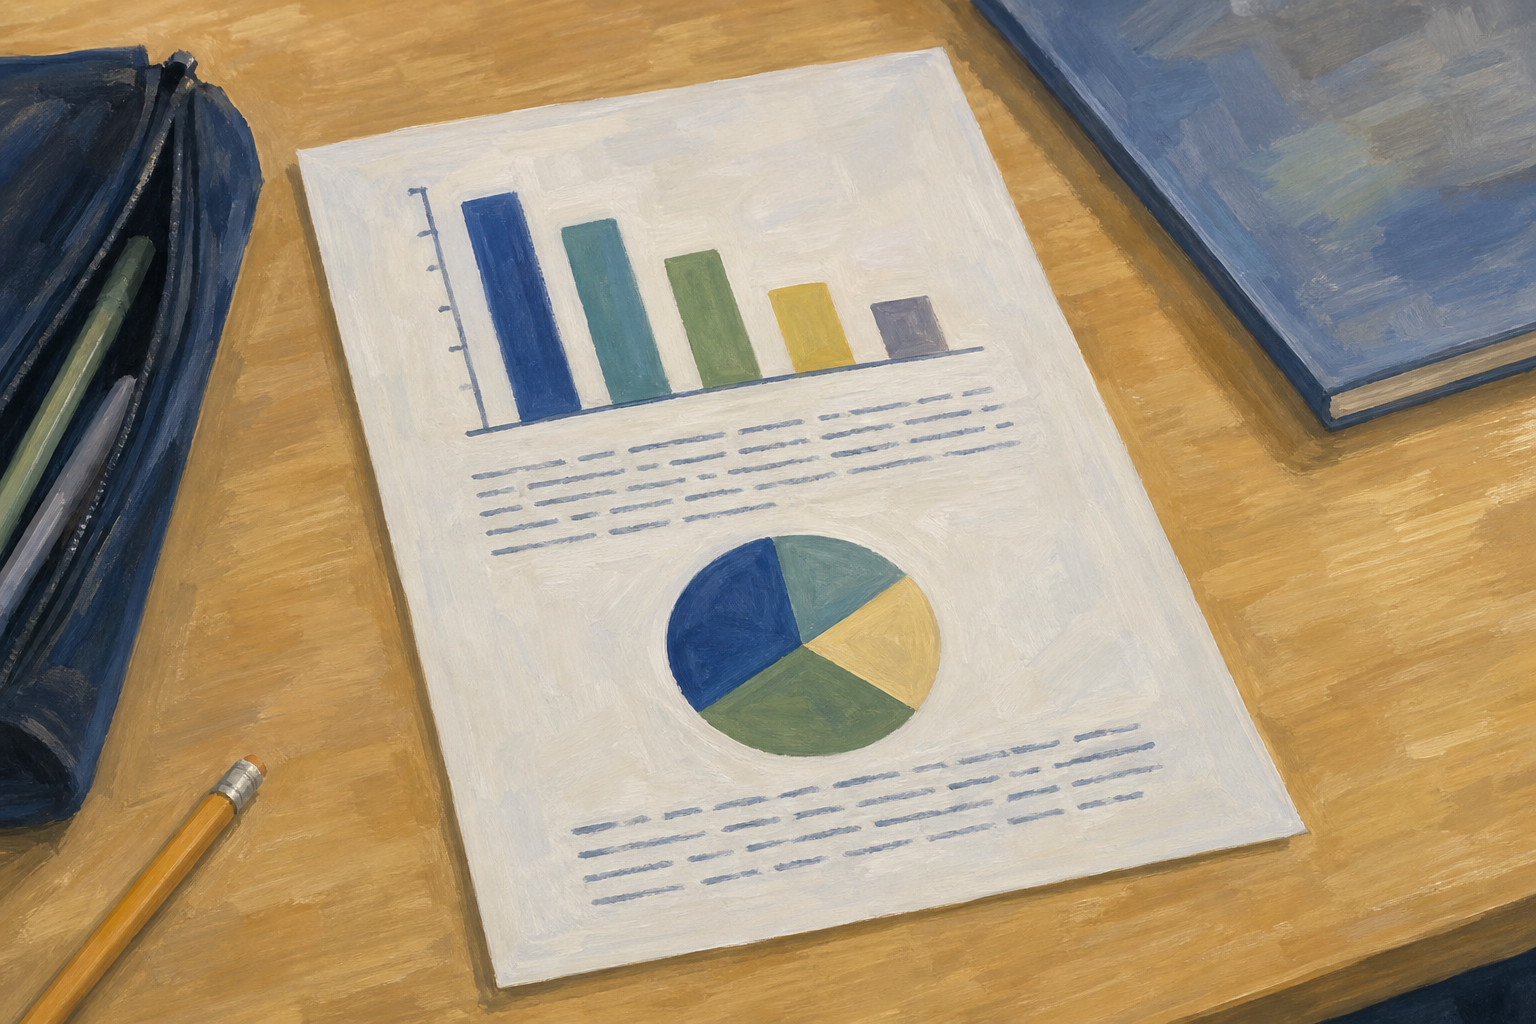
- put both pictures in one document with what they mean
- save that document as a PDF for your teacher
 This counts for your Key Assignment. If you can't find {{code:06_ka2_charts}}, tell your teacher.
Warm-up
Someone who never uses spreadsheets wants to see your chart. Would you send the whole workbook, or one clear picture with a few sentences?
A graphic is a picture file of your chart. Use PNG files, because they keep labels sharp.
An interpretation is a few sentences under a chart saying what it means. Each one says what the chart shows, the biggest value, the smallest value and one decision it helps you make.
A PDF is a copy of your document that never changes when someone opens it.
Pie chart: "The biggest slice is materials at 45%, so I will cut one supplier cost before I order stock."
Now you will save both charts as PNG files in {{code:06_charts}}. Follow the steps in the box below. Only do the ones for your computer. Don't open Word or Docs yet.
If your first snip is messy or cut off, that's normal. Delete it and try again.
Now you will make one document with both chart pictures and what they mean. Wait until your teacher has checked your PNG files, then follow the steps in the box below.
Your document should look like this. You'll save the PDF later, in Portfolio Build.
Chart interpretation: [your Something Real project name]
[Your name]
[Today's date]
Bar chart: cost by item
[bar chart picture]
Interpretation: [what it shows, the biggest value, the smallest value, one decision]
Pie chart: [your chart title]
[pie chart picture]
Interpretation: [what it shows, the biggest value, the smallest value, one decision]
If you get stuck
- If you can't find the PNG option in Sheets, click the chart first, then use the {{btn:⋮}} menu on the chart itself.
- If your snip only went to the clipboard, paste it into Paint with {{kbd:Ctrl+V}} and save it as a PNG.
- If a file has the wrong name or is in the wrong place, rename it exactly and move it into {{code:06_charts}}.
Unlock the full learning experience
You're previewing this lesson. Get full access to this lesson and hundreds more — each one ready to teach, with interactive activities, printable resources and pupil progress tracking built in.
This lesson is copyright of Coding Ireland 2017 - 2025. Unauthorised use, copying or distribution is not allowed.