1 - Introduction ~5 mins
Welcome
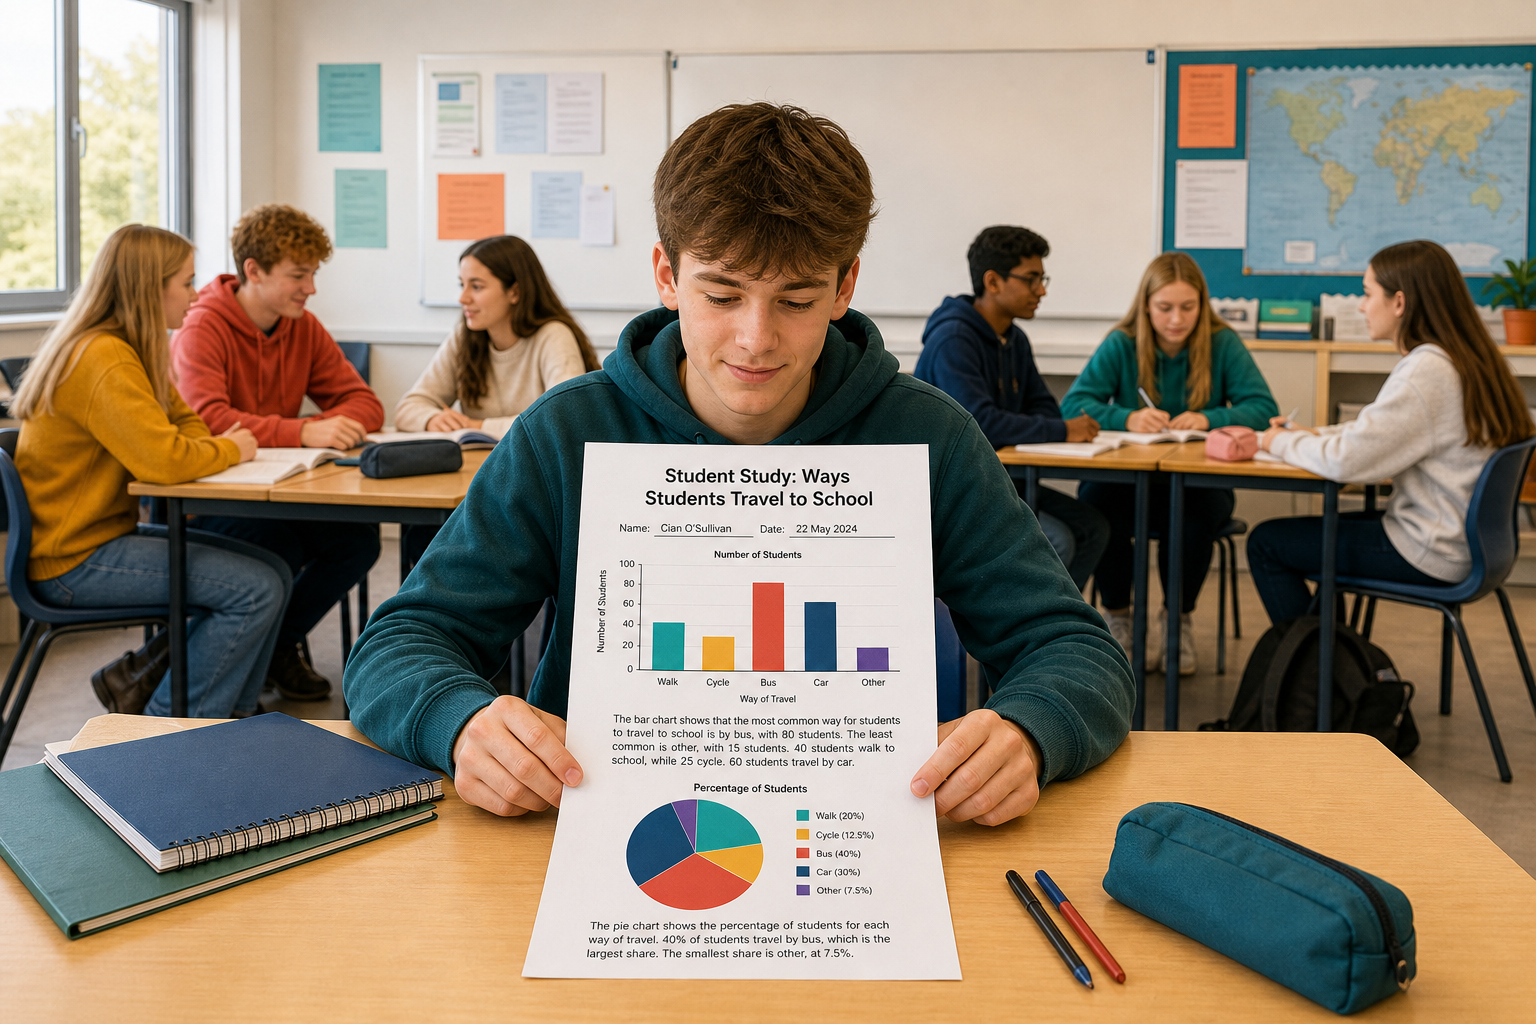 You already have bar and pie charts in {{code:06_ka2_charts}}. Today you turn them into clear KA evidence: PNG graphics, interpretations beside them in one document, and a PDF your LCA teacher can verify and bank.
Paper printing is optional. The required path today is graphic files + interpretation page + PDF — something you can attach, print later if needed, or drop into a pitch pack.
Missing {{code:06_ka2_charts}}? Tell your teacher straight away. Do not start a full rebuild during this lesson. Your teacher will seat you with a seed file, a neighbour’s structure model, or a short support task while the class exports. If you already have both charts and interpretations, you are ready for export.
By the end of this lesson, you will be able to:
- Export your bar and pie charts as PNG graphic files
- Build {{code:06_ka2_chart_interpretation}} with both images and your written interpretations
- Export {{code:06_ka2_chart_interpretation.pdf}} ready for teacher verification
- Self-check graphic-format and interpretation expectations
Warm-up
If you had to show one chart to someone who will never open a spreadsheet, would you rather send the whole workbook, or a clean image with three sentences underneath explaining what it means for your Something Real project?
2 - Key Concepts ~5 mins
Today you package chart evidence so a teacher (and a real reader) can open one file and understand it. Your teacher will confirm the exact SEC checklist your centre uses. Usual package: charts in graphic format plus written interpretation.
| Concept | Why it matters | Example |
|---|---|---|
| Graphic format — an image file such as PNG, not only a live chart inside a spreadsheet | Images travel cleanly into documents, emails, posters, and PDFs without needing Excel or Sheets | Your cost-by-item bar chart saved as {{code:06_bar_chart.png}} can drop into a Work Experience report or club committee pack |
| Interpretation document — a separate page that pairs each chart image with a short written reading | Evidence is not only “make a chart”; it is “show you can read it and use it for a decision” | Under the pie: biggest slice is materials at 45%, so you cut one supplier cost before ordering stock |
Quick note: use PNG only for this package (sharper for chart labels). You will export a PDF at the end so the page stays fixed for verification. Paper print is optional later if a printer is free.
Document structure (your teacher will project Aoife’s full example)
1. Title + name / date
2. Bar chart image → Interpretation (what it shows · biggest · smallest · decision)
3. Pie chart image → Interpretation (same four beats)
4. KA2 self-check line at the bottom
Evidence checklist (confirm exact wording with your teacher)
- Bar and pie charts from your Something Real numbers, each saved as PNG
- Written interpretation for each chart (what / biggest / smallest / decision)
- Editable {{code:06_ka2_chart_interpretation}} plus {{code:06_ka2_chart_interpretation.pdf}} in {{code:06_charts}}
3 - Export Charts as PNG Graphics ~12 mins
Guided practice — chunk 1 of 2 (PNGs only). Follow the steps for your suite. Export both charts as PNG files into {{code:06_charts}}. Do not open Word or Docs yet.
Hands up when both filenames are visible in the folder: {{code:06_bar_chart.png}} and {{code:06_pie_chart.png}}. Wait for your teacher before chunk 2.
If stuck on snip, clipboard, or rename: use the Common Issues table in the next section (or ask your teacher to point at it now). First snip messy or cut off is normal — delete and try again with a little margin around the chart only.
4 - Build the Interpretation Document ~12 mins
Guided practice — chunk 2 of 2 (document only). Only start when your teacher has checked chunk 1. Create editable {{code:06_ka2_chart_interpretation}} inside {{code:06_charts}}, insert both PNGs, and place your own interpretations under each image.
You do not need the final PDF yet. PDF export, the KA2 self-check line polish, and teacher verification happen in Portfolio Build.
5 - Common Issues ~3 mins
Common Issues
Use this table during PNG export (chunk 1) and again if PDF naming goes wrong.
| Issue | Solution |
|---|---|
| I cannot find Download → PNG on my chart (Sheets) | Click the chart first so the chart menu appears, then open the three-dot {{btn:⋮}} menu on the chart (not the spreadsheet File menu). Choose Download, then PNG image. |
| Excel Online has no Save as picture option | That is normal in the browser app. Select the chart and capture just that area with your OS screenshot tool, then save a real file: Windows toast Save or Paint {{kbd:Ctrl+V}} then {{menu:File -> Save as}} PNG; Mac rename on Desktop; Chromebook rename in Files → Downloads. Upload {{code:06_bar_chart.png}} or {{code:06_pie_chart.png}} to {{code:06_charts}}. |
| My snip only went to the clipboard / I have no PNG file | On Windows, click the preview toast and Save, or paste into Paint and save as PNG. Do not skip straight to Upload — OneDrive needs a real file, not only a clipboard image. |
| My PNG is blurry or cut off | Capture only the chart with a little margin, not the whole window. In the document, enlarge the image until labels are readable, without stretching it sideways only. |
| My interpretations are still only in the spreadsheet | Copy the sentences from under each chart in {{code:06_ka2_charts}} into {{code:06_ka2_chart_interpretation}} under the matching image. Check what / biggest / smallest / decision. |
| I saved the document in the wrong folder or left it named Document/Untitled | In OneDrive or Drive, rename the editable file exactly {{code:06_ka2_chart_interpretation}} and move it, both PNGs, and later the PDF into {{code:06_charts}}. Future files: open the folder first, then click New inside it. |
| My PDF landed in Downloads with a generic name (or the long document title) | Rename the file exactly {{code:06_ka2_chart_interpretation.pdf}} and move or upload it into {{code:06_charts}} beside the editable file. Open it once to confirm both images and both interpretations are visible before you show your teacher. |
Unlock the full learning experience
You're previewing this lesson. Get full access to this lesson and hundreds more — each one ready to teach, with interactive activities, printable resources and pupil progress tracking built in.
This lesson is copyright of Coding Ireland 2017 - 2025. Unauthorised use, copying or distribution is not allowed.