In this lesson, you'll build on your understanding of algorithms and flowcharts, and learn about pseudocode as a tool for planning code. You'll create your own flowcharts and pseudocode, then see how they translate into a simple program using MakeCode for micro:bit. By the end, you'll design your own algorithm from scratch.
Here's what you'll cover:
In the previous lesson we introduced you to algorithms and flowcharts, let's recap what we learned.
An algorithm is simply a step-by-step set of instructions that helps you solve a problem or complete a task. Imagine it as a clear guide that tells you exactly what to do, one thing at a time, in the right order, so you end up with the result you want.
Flowcharts are visual representations of algorithms using shapes and arrows to show the flow of steps and decisions.
Used for the start and end of the algorithm. It marks where the process begins and finishes.

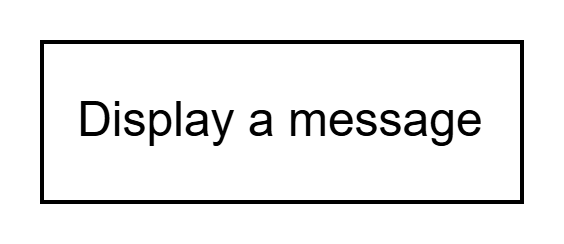
Represents a process or action step, like "Display a message" or "Calculate a sum".

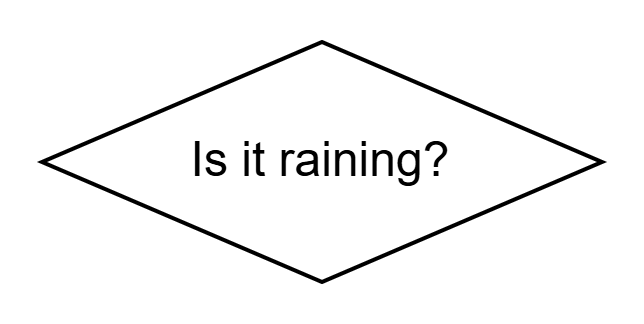
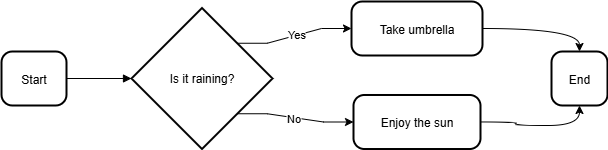
Indicates a decision point, where the flow branches based on a yes/no question, such as "Is it raining?".

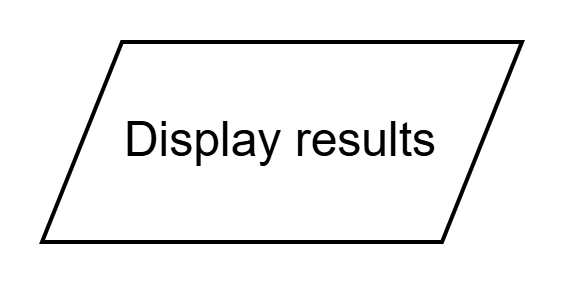
Often used for input or output, like reading data from a user or showing results.

Shows the direction of the flow, connecting the shapes in the correct order.

Here's a simple flowchart for making a decision about going outside based on the weather: It starts with an oval 'Start', then a diamond decision 'Is it raining?', with 'Yes' leading to a rectangle 'Take umbrella' and 'No' leading to a rectangle 'Enjoy the sun', both connecting to an oval 'End'.
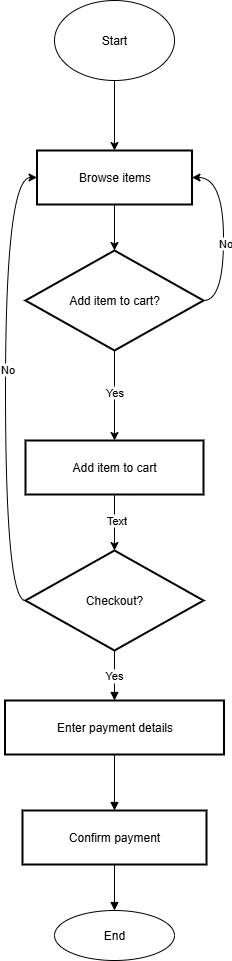
Now it's time to practise creating your own flowchart. You'll design a simple flowchart for an online shopping cart process using the tool you've used before at www.drawio.com.
The flowchart should represent a basic online shopping experience: starting from browsing items, deciding to add to cart, continuing shopping or checking out, and ending with payment confirmation.
Follow these steps to create your flowchart.
Note: You do not have to use this algorithm and flowchart exactly, you can design your own online shopping algorithm.
Make sure all paths connect logically with arrows showing the flow. Adjust the layout to make it clear and readable. You can add colours or resize shapes if you like. Once complete, save your diagram (you can export it as an image or PDF if you want to keep it).
Let's move on to another important tool for planning algorithms: pseudocode. Pseudocode is a way to describe the steps of an algorithm using simple, human-readable language that looks a bit like programming code, but without worrying about the exact rules of a specific programming language. It bridges your flowchart to potential code.
Pseudocode acts as a bridge between your ideas (like those in a flowchart) and actual code. It helps you outline the logic of your program clearly before you start coding. This makes it easier to spot mistakes early and ensures your algorithm is precise, finite, effective, and efficient.
IF, ELSE, WHILE, FOR, to show decisions and loops.SET age TO 16READ input or DISPLAY messageIF condition THEN ... ELSE ... END IFWHILE condition DO ... END WHILE or REPEAT ... UNTIL conditionSTART and ends with ENDRemember the weather flowchart from earlier? Here's how it might look in pseudocode:
START
IF it is raining THEN
Take umbrella
ELSE
Enjoy the sun
END IF
END
This matches the flowchart's decision diamond and process rectangles, but in text form. It's simple and helps you think through the steps before coding.
You're previewing this lesson. Get full access to this lesson and hundreds more — each one ready to teach, with interactive activities, printable resources and pupil progress tracking built in.