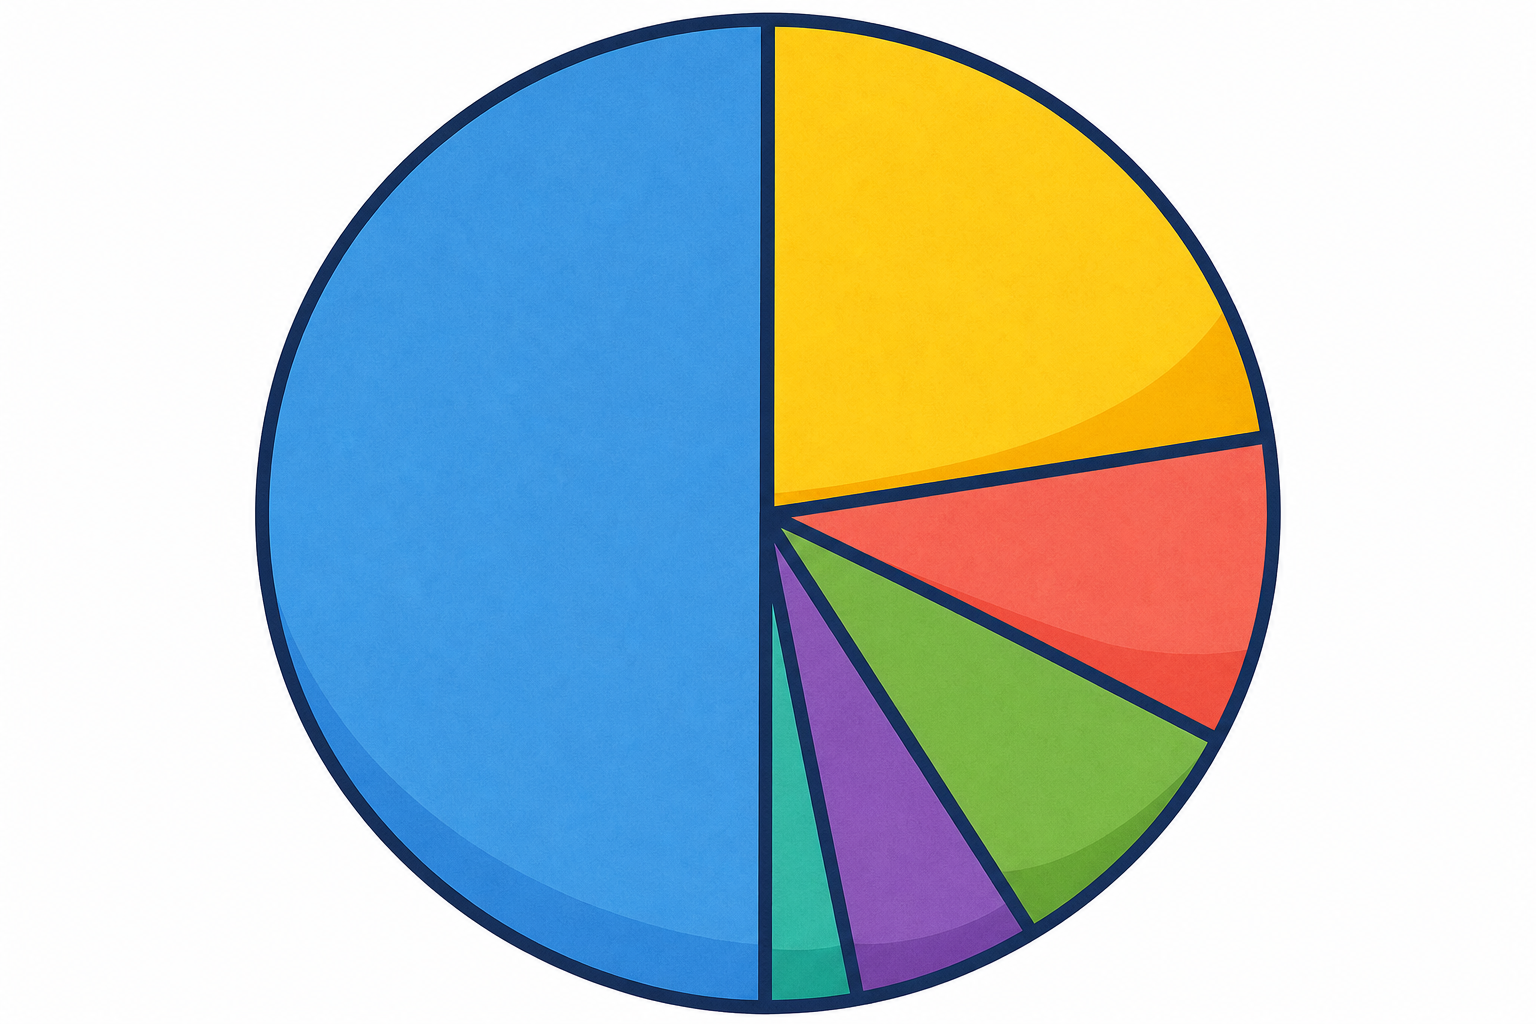
Look at the pie chart on the screen. Each slice stands for a different fruit the class chose for break.
Which slice is the biggest? Roughly what fraction of the whole class chose it, and how can you tell just by looking?
Take three hands-up answers, not open call-outs. Give five seconds of quiet think-time first.
Listen for pupils reasoning from size (the half is clearly the biggest) rather than guessing. Revoice a strong answer: so the size of the slice tells us the size of the group.
Watch three pie charts on the board. In each one, notice how the size of every slice matches the size of its group, and how a half-slice turns exactly halfway round the circle.
The last one is trickier: the groups are 12, 6 and 2 out of 20. Be ready to say what fraction of the whole each slice is.
Today we build a pie chart together from a lunch survey of 20 pupils:
We add each group in turn and watch its slice grow. Take the sandwich slice: 8 pupils out of 20. Name the fraction, then read the percentage off the chart.
Notice the salad slice: 4 out of 20. Name that fraction and say what simpler fraction it is.
We do the same for each slice. As each one appears, we name its fraction of 20. Then we read its percentage off the chart.
Talk this one through together — pupils take turns at the board and the class agrees or corrects out loud.
Have individual pupils step each category up to its count. As each slice grows, pause and ask 'what fraction of 20 is that?' before reading the percentage the tool shows. Build the sandwich bridge visibly first: 8 out of 20 → 8/20 → 40%. Then wrap 6/20 = 30%, salad 4/20 = 20% (and 4/20 = 1/5), soup 2/20 = 10%. Finish by adding the four percentages aloud to reach 100%.
In your maths copy, record each slice of the lunch-survey pie chart as a fraction, a decimal and a percentage in three columns, one row per slice.
Sandwich first. The count is 8 out of 20, so the fraction is 8/20. To get the decimal, divide the top by the bottom: 8 ÷ 20 = 0.4. To get the percentage, multiply the decimal by 100: 0.4 × 100 = 40%. So one row reads 8/20, 0.4, 40%.
Use the same three steps for Wrap, Salad and Soup. When you have all four rows, add up the percentage column to check it totals 100%.
Board the sandwich bridge once before anyone writes: 8/20 → divide 8 ÷ 20 = 0.4 → 0.4 × 100 = 40%. Point at each arrow as you say it.
Then release the class to the four rows. Walk the room glancing at the percentage-column total, this is whole-class copybook practice, not marking.
Slip to watch: pupils who write 8.20 or 20.8 instead of dividing; prompt top ÷ bottom. Simplifying (8/20 to 2/5, then 0.4) is a good sign, not required.
Quick check values if needed: Wrap 6/20 = 0.3 = 30%, Salad 4/20 = 0.2 = 20%, Soup 2/20 = 0.1 = 10%.
Now match the data to the right pie chart. We work through these frequency tables together, each one a step harder:
On the last table, predict which slice is exactly one fifth before we check.
This is the practice round — pupils take turns at the board, check each answer, and the class confirms before moving on. Keep the board work brisk rather than over-explaining.
The first two are access-level (halves and simple thirds). The third forces reading three unequal slices. The fourth adds a fourth slice, so pupils must check all four percentages sum to 100%. Save the one-fifth prediction for the last table only, since it is the only one with a fifth: prompt 'the 8 and the three 4s — which is exactly one fifth?' (each 4 is 4/20 = one fifth).
You're previewing this lesson. Get full access to this lesson and hundreds more — each one ready to teach, with interactive activities, printable resources and pupil progress tracking built in.