1 - Getting Started ~5 mins
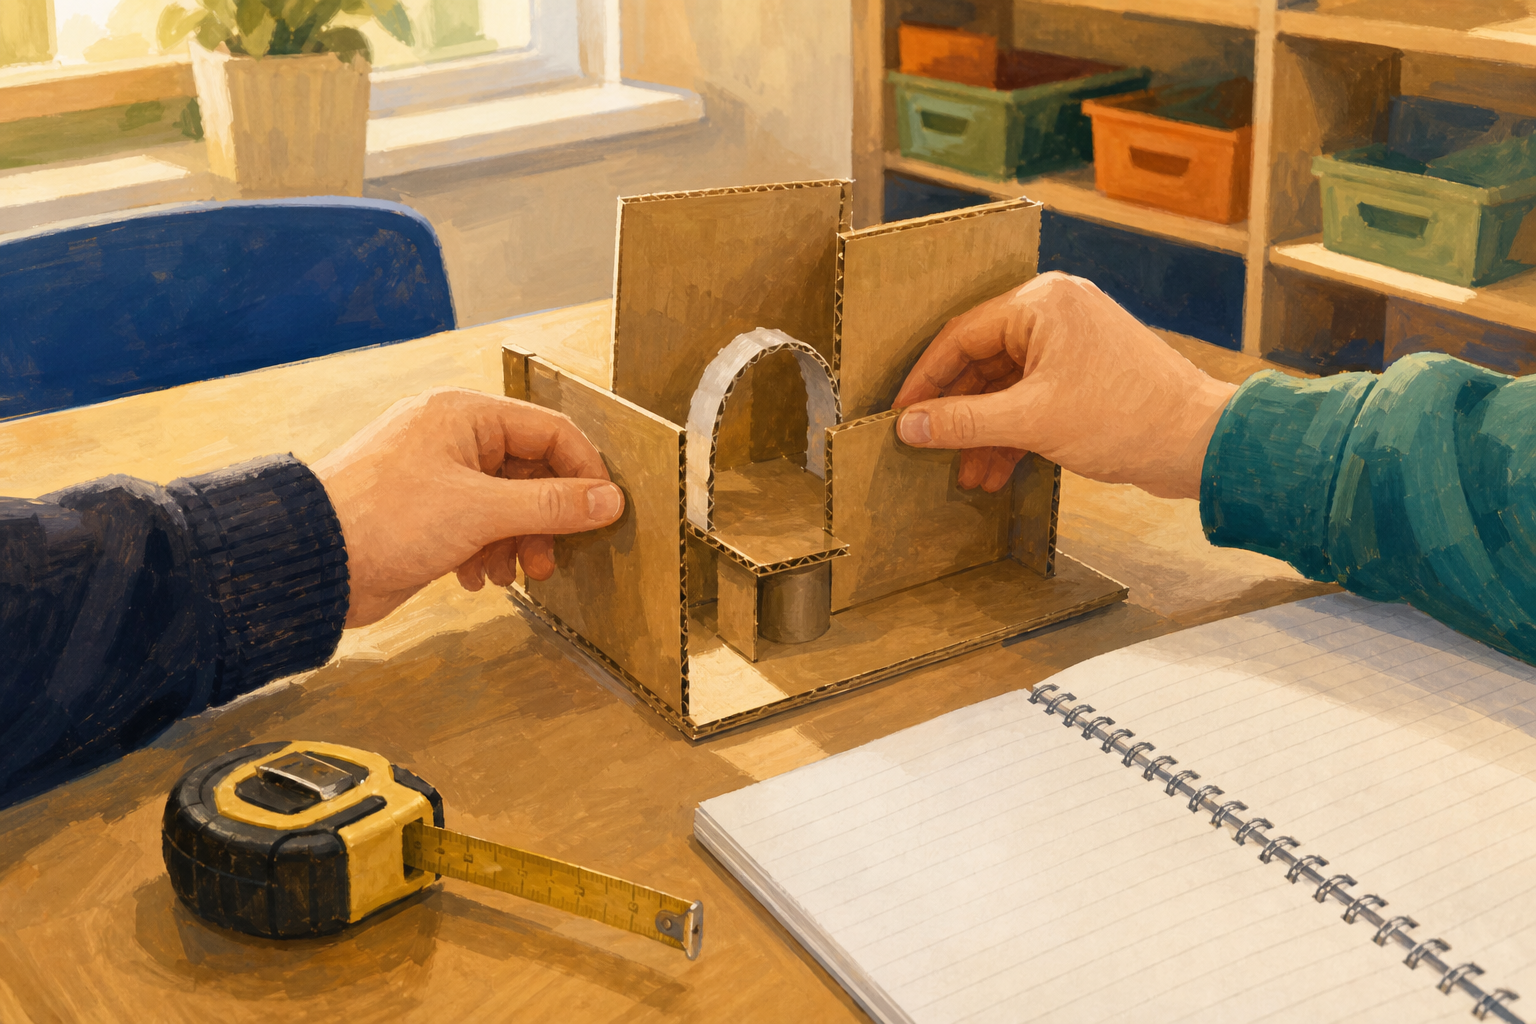 Think back to the user you designed for and the prototype your group made earlier in this project. What did you promise it would do? Today we find out for real. Does it actually work? Let's put it to the test, listen to another group, make it better, and show what we learned. Have your prototype and your Design Brief with your success criteria out on the desk, ready to go.
Keep this light and quick. Groups pull out the prototype they built earlier in this project and the Design Brief with their success criteria.
Ask: What does a good solution have to do, and how will we know it works? Read out one group's criteria as an example so every group re-anchors on theirs.
2 - What We Are Doing Today ~5 mins
Engineers do not just build. They test against a plan, listen to others, and improve. Here are the three words we will use as we go. You will use each one at a different moment: success criteria when you test, iteration when you improve, and peer feedback when you swap prototypes with another group.
| Concept | Why it matters | Example |
|---|---|---|
| Success criteria — the clear things your design must do to count as working | Without them you cannot say if the design passed | A book stand must hold a book open and stand on its own without toppling |
| Iteration — one improvement you make after testing, then you test again | The first try is rarely the best | Adding a wider base so a stand stops wobbling and tipping over |
| Peer feedback — what another group notices, said kindly and usefully | A fresh pair of eyes spots problems you stopped seeing | A partner group noticing the book slot is too narrow to hold the pages |
This table is pupil-facing (3rd/4th class) — read it quickly with the class from the screen, don't dwell. The 'Why it matters' column is deliberately short so it's a glance, not a lecture; you point at each term again at the moment groups actually use it (testing, improving, swapping) rather than front-loading all three now.
Model the tone of good feedback before they use it: two stars and a wish works well — two things that work, one thing to improve. Head off the common problem of vague praise ("it's nice") by insisting feedback names a specific part.
3 - Test Against Your Criteria ~12 mins
Your PrototypeEval page should be on the desk in front of you — that is where you write everything down. Now test your prototype. Take each success criterion one at a time and check it honestly. Did it hold the weight? Did it stay dry? Did it fit the space? Write down exactly what happened — not what you hoped, what you saw.
Where a criterion has a number, measure it and write the number down. Test each thing twice so you can trust the result. If your two tests give different numbers, test one more time and record the middle number of the three. If a test is pass or fail rather than a number, just write pass or fail.
Before the lesson: gather whatever each group's test needs — small weights, a water tray, a timer. Push back the desks so load tests have clear space. Make sure each pupil has their PrototypeEval page out before you start.
Circulate and press for honesty: What did you actually see? Did it pass or not quite? A criterion that fails is data, not failure — it points straight at the improvement.
Reconciling two tests: the rule on screen is simple — if the two numbers differ, test a third time and take the middle value of the three. This keeps the number that goes to the chart in step 4 unambiguous. If a group's test is pass/fail rather than a number, they record pass or fail and will say it aloud at the next step.
4 - Record and Chart the Results ~5 mins
Let's pool the results so we can talk about them together. If your group measured a number in the same test and same unit as another group (for example, grams held in a load test), we will type those numbers into the table on the board and turn them into a chart so we can compare fairly. If your group's test was pass or fail, or measured a different thing, you will say your result aloud and the class will discuss it — your group is still part of this step, we just talk about your result rather than chart it.
Remember: a taller bar only means "more" of the same thing measured the same way. We are not racing each other. Every group tested a different design for a different user, so the important question is whether your design met your criteria.
How did the like-for-like tests do?
Drive the data-recorder on the IWB. The table has two columns — Group and Result — with room for a full class of groups. Only chart groups that measured the same quantity in the same unit (e.g. all the load-test groups in grams). Type each of those groups' results, then press the chart button so the bars appear.
Do not mix grams and seconds on one axis — those bars are not comparable and the tallest tells you nothing about design quality. Groups that measured something different, or ran a pass/fail test, stay oral: they say their result aloud and we discuss it.
Ask, of a like-for-like set only: These groups all measured the same thing the same way — what do the different bars show us? Steer firmly away from "biggest number wins": remind the class each design was made for a different user and judged against its own criteria.
5 - Gather Feedback and Iterate ~18 mins
Show your prototype to another group, and to your user if they are here. Ask them: what works well, and what could be better? Note the feedback on your PrototypeEval page.
Now pick just one improvement — the one the evidence and the feedback point to most clearly. Make that change to your design, then test the same criterion again. Did the change help?
Before the lesson: gather spare junk-modelling materials so each group can make its one improvement.
Hold groups to a single iteration — the discipline of choosing the most important change is the learning. Ask: Which change will make the biggest difference to the user?
After the change, insist they re-test the same criterion so they have evidence the iteration actually helped, not just a feeling.
Unlock the full learning experience
You're previewing this lesson. Get full access to this lesson and hundreds more — each one ready to teach, with interactive activities, printable resources and pupil progress tracking built in.
This lesson is copyright of Coding Ireland 2017 - 2025. Unauthorised use, copying or distribution is not allowed.