Computer Science
Beginner
240 mins
Teacher/Student led
What you need:
Chromebook/Laptop/PC

Refining, Testing, and Visualising the Model

In this lesson, you'll refine, test, and visualise your model from previous work. Follow steps to analyse simulation outcomes, create graphs, modify models hands-on, collaborate with peers for feedback, and reflect on limitations to prepare for evaluation.
Learning Goals Learning Outcomes Teacher Notes

Teacher Class Feed

Load previous activity

    1 - Introduction

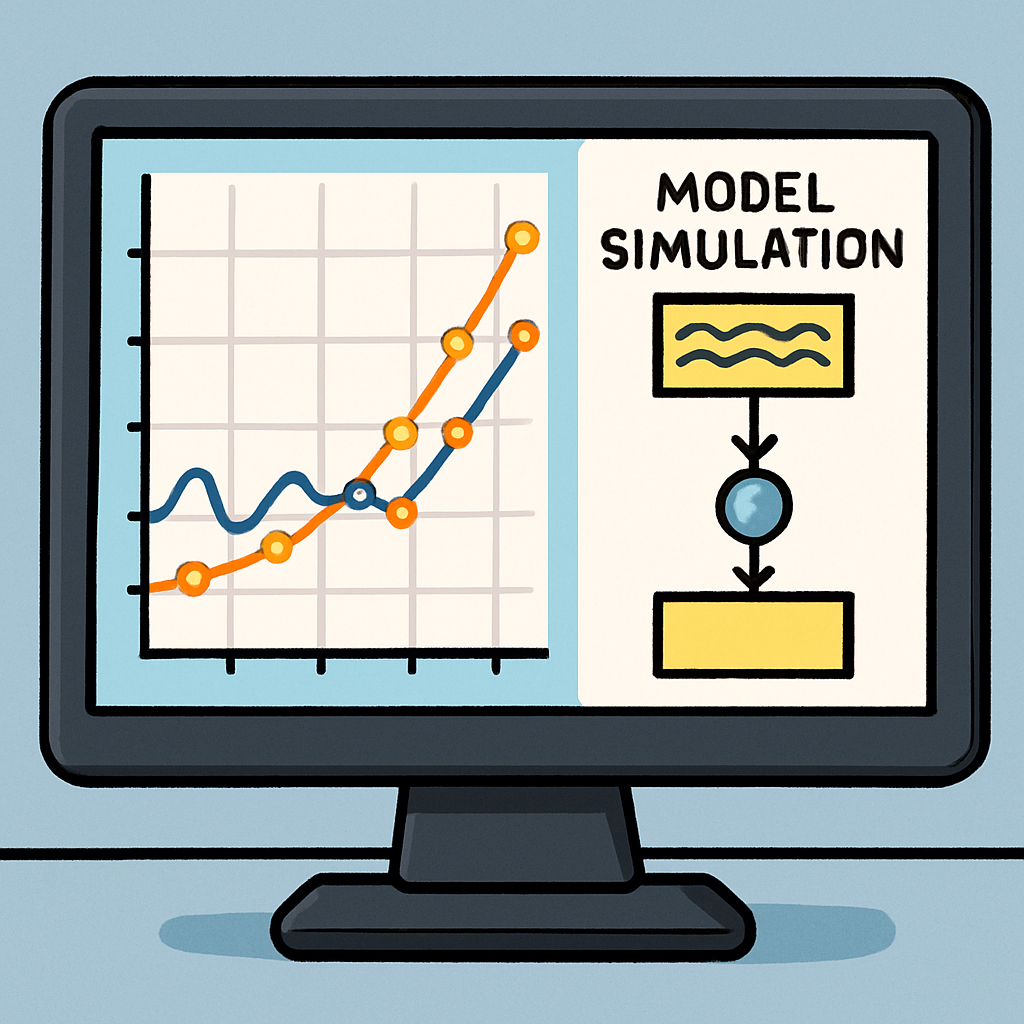
    In this lesson, you'll refine, test, and visualise your model from previous lessons in ALT 3. You'll analyse simulation outcomes, create visualisations using diagrams and graphs, run and modify models hands-on, participate in team review exercises, and emphasise the limitations of your model.

    This step is crucial as it helps you understand how models can be improved through iteration and how visual tools can reveal insights into complex systems. You'll also explore emergent behaviours in agent-based modelling, building on concepts from computational thinking.

    By the end, you'll have a refined model with visual insights, ready for evaluation.

    2 - Analyse Simulation Outcomes

    Start by analysing the outcomes of your initial model simulations. This involves interpreting results before and after modifications to understand how changes affect behaviour.

    Steps to Follow:

    1. Run your existing model from the previous lesson (e.g., a simulation of traffic flow or population growth) and record key outputs, such as average values or patterns observed.
    2. Compare these to your expected results: Note differences, like if the simulation shows unexpected congestion in a traffic model.
    3. Make a small modification, such as adjusting a variable (e.g., increase agent speed in an agent-based model), then re-run and record new outcomes.
    4. Interpret changes: Explain why modifications led to different results, considering emergent behaviours in agent-based modelling.
    Activity: Write a short paragraph in your notes analysing one before-and-after scenario, highlighting benefits like how agent-based modelling reveals unexpected patterns.

    3 - Visualise with Diagrams and Graphs

    Create visualisations to communicate your simulation outcomes effectively. Use diagrams and graphs to represent data, making it easier to spot trends and limitations.

    Steps to Follow:

    1. Identify key data from your simulations (e.g., time series data like population over time).
    2. Sketch a simple diagram manually, such as a flowchart showing model flow or a graph plotting variables.
    3. Use Python's matplotlib library (from the 'Python Basics' module) to generate digital graphs. Install if needed via pip: pip install matplotlib.
    4. Code a basic graph: For example, plot simulation data.

    Example Code:

    import matplotlib.pyplot as plt
    
    # Sample data from simulation
    time = [0, 1, 2, 3, 4]
    population = [100, 120, 140, 130, 150]
    
    plt.plot(time, population)
    plt.xlabel('Time')
    plt.ylabel('Population')
    plt.title('Population Growth Simulation')
    plt.show()

    4 - Hands-On: Run and Modify Models

    Get hands-on by running your model under different scenarios and modifying it to test refinements. This develops your model to allow scenario testing.

    Steps to Follow:

    1. Open your Python model code from the previous lesson.
    2. Run the simulation with default parameters and note results.
    3. Modify parameters (e.g., change initial conditions or add randomness for realism) and re-run to test scenarios.
    4. Iterate: Based on analysis, refine algorithms (e.g., adjust a loop for better accuracy) and test again.

    Example Modification Code Snippet:

    # Assume a simple population model
    def simulate_population(initial_pop, growth_rate, steps):
        pop = initial_pop
        results = [pop]
        for _ in range(steps):
            pop += pop * growth_rate  # Modify growth logic here if needed
            results.append(pop)
        return results
    
    # Run with modifications
    results = simulate_population(100, 0.1, 10)  # Change growth_rate to test
    Activity: Run at least three scenarios and document outcomes, focusing on how modifications reveal limitations like oversimplification.

    5 - Team Review Exercises

    Collaborate with peers for feedback on your model. This team review helps identify improvements and aligns with collaborative practices from strand 1.

    Steps to Follow:

    1. Pair up with a classmate or form a small group (2-4 students).
    2. Share your model, visualisations, and analysis: Present your simulations and explain key outcomes.
    3. Review each other's work: Discuss strengths, suggest modifications (e.g., 'Add more variables for realism'), and note limitations like scalability issues.
    4. Incorporate feedback: Make one change based on the review and re-test.
    Tip: Use shared documents or a simple online tool (if available) to exchange files. This exercise emphasises diverse perspectives.

    Unlock the Full Learning Experience

    Get ready to embark on an incredible learning journey! Get access to this lesson and hundreds more in our Digital Skills Curriculum.

    Copyright Notice
    This lesson is copyright of Coding Ireland 2017 - 2025. Unauthorised use, copying or distribution is not allowed.
    🍪 Our website uses cookies to make your browsing experience better. By using our website you agree to our use of cookies. Learn more