1 - Start: What We're Building ~5 mins
Quick recap: last day, what does a forever loop let our program keep doing? Today we're back in MakeCode for micro:bit to make our device show live sensor data as a graph on its LEDs. Open the project you saved earlier — we'll predict first, then build, run and fix as a class.
Open the saved project on the board so students see this as a continuation. Ask: what does a forever loop do for us? Keep this brief — just enough to frame today's build before pairs settle at their devices.
2 - Predict Before You Run ~10 mins
Before anyone runs anything: look at what we're about to build. When the program runs, what do you think the micro:bit will show first? What will happen on screen if the light around it changes? Commit to a prediction with your partner before you press run.
Run the PRIMM predict beat: collect two or three predictions about what the micro:bit will show first and how the display will react to light. Write them on the board and tell students you'll come back to them. Don't confirm or correct yet.
3 - Create a New Project ~5 mins
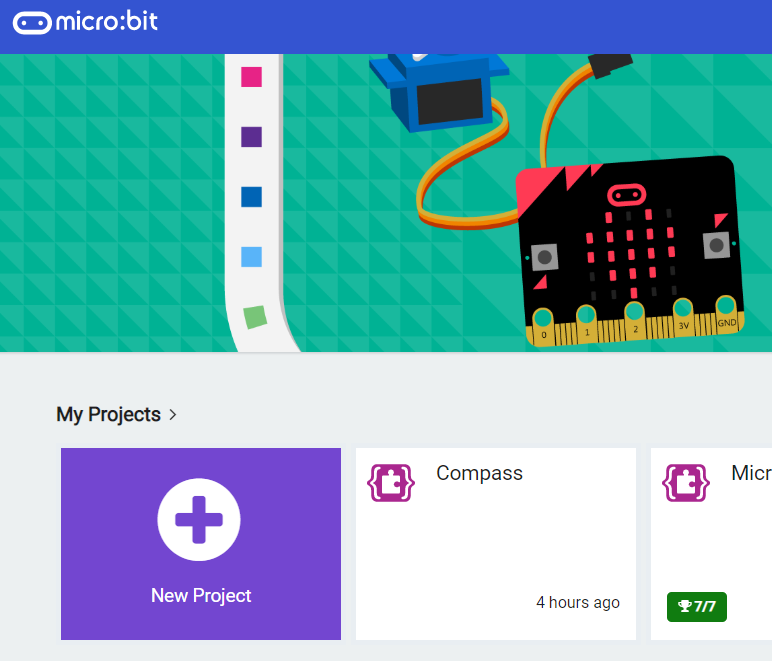
Go to the makecode.microbit.org website and create a new project.
Go to the Makecode.com Microbit website using the link below and click on the 'New Project' button underneath the 'My Projects' heading.
https://makecode.microbit.org/
Install the micro:bit app on your iPad or tablet.
Open the app, tap 'Create code' and then create a new project.
Model navigating to the editor and starting a new project on the board so no one is lost on setup. Watch for students who stay on the old project tab; make sure everyone has a fresh workspace before moving on.
4 - Show Light Level ~5 mins
The first sensor that we'll look at is the light level sensor. This senses how much light from the surrounding environment is hitting the front of the Microbit.
This number can be between 0 (black) and 255 (white).
Let's display the light level on the Microbit now.
basic.forever(function () {
    basic.showNumber(input.lightLevel())
})
You can change the amount of light on the Microbit simulator by using the yellow/grey circle in the top left corner (watch the gif for this step).Make sure to download the code on to your Microbit to test it out for real by shining more/less light on it!
Give your project a name and send it to your Microbit by following these steps:
- Type "your project name" into the Project Name box.
- Connect your Microbit to your computer using the USB cable.
- Click the 'Download' button (a file called 'microbit-project-name.hex' will be downloaded to your computer).
- Open the folder on your computer where the file downloaded to.
- Right click on the file.
- Click Send To.
- Click Microbit.
- Power your microbit with a USB cable or battery pack
- Pair your microbit with your iPad/tablet (hold the A and B buttons and press and release the Reset button)
- Flash your project to your microbit
Demonstrate the light-level display on the projected simulator and show the yellow/grey dial that changes the light. Key question: what numbers do you expect to see, and why does black give a low number? Common issue: students miss that the value updates live — point out the dial. Support: keep less-confident students on the simulator before downloading.
5 - Graph Light Level ~5 mins
We'll now do something a bit more interesting using the light level. We can view the light level on a graph that will illustrate the changes in light.
basic.forever(function () {
    led.plotBarGraph(
    input.lightLevel(),
    255
    )
})
You can view the graph on the simulator on your computer (click the "show data" button under the Microbit). Change the light level on the Microbit simulator and see how the graph changes!
Then, download the code on to your Microbit.
Show the bar graph on the simulator and click <em>show data</em> so students see the line move. Ask what the second value in the block is for. The classic bug here is a graph that's always full or always empty because the maximum doesn't match the range — talk through why 255 fits the light sensor.
Unlock the full learning experience
You're previewing this lesson. Get full access to this lesson and hundreds more — each one ready to teach, with interactive activities, printable resources and pupil progress tracking built in.
This lesson is copyright of Coding Ireland 2017 - 2025. Unauthorised use, copying or distribution is not allowed.